


Gear noise results from the gear mesh dynamic forces that are transmitted through the support shafts and bearings to the gear housing. There are many sources of these forces, with the most important of these being predicted by analyzing the mechanics of the meshing process. It is important that this analysis takes into account the microgeometry of the mating teeth. Although the noise is dynamic in nature, the noise metrics used in this paper will be treated in a static manner, thus allowing the designer to attempt to minimize these excitations at the design stage. This paper identifies three major excitations of gear noise and will demonstrate these static excitations using three different helical gear geometries.
Gear Noise Excitations
The following phenomena have been felt to be noise excitations [1,2]:
• Tooth impacts
• Mesh stiffness variation
• Transmission error
• Force axial shuttling
• Friction
• Air and lubricant entrapment
These excitations were briefly discussed in an earlier article in Gear Solutions [3] so they will not be discussed in detail here. Transmission error, which is partially the result of mesh stiffness variation, has long been considered to be a major excitation, but as will be shown in this paper, forces due to axial shuttling and friction may have the same orders of magnitude as the forces created by transmission error.
In most gear designs, lead crowning is applied in order to allow the gear pair’s contact to remain partially centered, thus compensating for inevitable misalignments that occur due to a combination of shaft misalignments and manufacturing and assembly errors that result in lead variations. In this paper we will show how the three excitation forces vary as a function of load for lead crowned helical gears that have three different contact ratios.
Load Distribution Analysis
The key to performing an appropriate analysis of mesh excitations is the evaluation of the distribution of forces along the contact lines. A requirement of this analysis is the ability to account for either the design tooth topographies or the actual measured topographies of the tooth surfaces. This analysis requires a good contact algorithm as well as an evaluation of tooth compliances. The analysis is certainly feasible using finite element analysis [4], but may also be done using elemental stiffnesses. In our case, this is done using a program called the Load Distribution Program (LDP) [5], which essentially discretizes the contact lines into individual segments and then uses the equations:
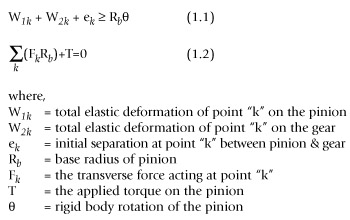
The solution of these equations is iterative, but is computationally fast. The compliances that are included are:
• Tooth bending and shear using a plate deflection analysis.
• Contact deflection using a classical Hertzian analysis.
• Tooth base rotation and base translation using an empirical analysis based on non-dimensionalizing finite element analyses.
It is interesting to note that the effects of each of these three deflections is about the same, mainly because each gear tooth acts as a short, stubby plate such that the classic assumptions of beam and/or plate theory are violated.
Bearing Force Calculation
In the LDP analysis, each contact line is divided into discrete segments and the force at each segment is calculated. Bearing forces are calculated by applying the principles of statics using sum of moments about one bearing to compute the forces at the other bearing. Normal forces are used to obtain the shuttling force. Friction forces act at right angles to the tooth normal force, and again, applying sum of moments about one bearing may be used to compute the effective friction force at the other bearing. An approximation of the transmission error force is determined by placing at the center of the tooth contact pattern a normal force whose magnitude is the product of transmission error and average mesh stiffness. Once again, we apply the sum of moments to obtain the effective transmission error force at the bearing. In this analysis, we obtain the term called “sum of forces” by first obtaining the mesh frequency values of each of the three forces and then simply adding these values.
Example Analysis
Evaluated in this paper are three different helical gear pairs that have progressively higher total contact ratios as shown in the geometry summaries of Table 1. Figure 1 shows the respective transverse cross-sections of the three gear pairs. These gear pairs have been tested at NASA [6] and analyzed at The Ohio State University [7] and have been shown to become quieter as contact ratio increases.


The circular lead crown applied to each gear pair is 17.8 micron. A microtopography analysis similar to that done in [3] was used to establish the profile crown that would minimize transmission error when operated at a pinion torque of 454 N-m. Figure 2 shows the respective design charts for profile and lead for the medium contact ratio gear pair (pair M) as well as the tooth topography that results from these modifications.

The analysis of gear pair M, the medium contact ratio set, was first run at a mid-range torque of 454 N-m and the predicted bearing forces due to transmission error, shuttling and friction are respectively shown in Figure 3. The transmission error force is by far the lowest, but this is because the profile modification was selected so that transmission error would be minimized at this torque. Subsequent figures will show that the transmission error and shuttling forces are usually of the same order of magnitude and that friction forces, although smaller, still may be significant. For both shuttling and friction, the mesh frequency component is dominant. However, the second harmonic has the largest amplitude for the transmission error force.

Next we perform simulations at 50 torques and show the effect of torque on each of the force components as well as its effect on quantities such as the force carried by one tooth pair, bearing forces, transmission error, and effective contact ratio.
Since the tooth surface is crowned in both directions, at light loads one would expect the contact pattern to be localized in the center of the tooth and as load is increased, the pattern will continue to grow until contact spreads across the entire tooth surface. Figure 4 shows, as would be expected, that as torque increases the load carried by a single tooth pair also increases. Also, the duration of contact increases with load, indicating that the load is being shared by more tooth pairs as torque loading increases. The length of this contact on the x-axis is normalized to base pitch and this contact length for any load is actually the average number of tooth pairs in contact, which may be considered to be the “effective contact ratio” of the gear pair. The relationship between load and this effective tooth contact ratio is shown in Figure 5, where the effective contact ratio levels off at the theoretical contact ratio when “full” contact is achieved.

pair of gear Set M.

Figure 6 shows a Harris Map [8] for gear pair M. This map, which plots the transmission error trace at each load, shows that at no load, the transmission error mimics the non-conjugacy of the tooth pair along the path of contact on the tooth. As the load increases, the load starts being shared by additional tooth pairs and the transmission error trace flattens in the region between the dashed extensions of the profile shape. Eventually, load sharing is such that the transmission error becomes very flat and a minimum level occurs. Further increases in load causes the transmission error to increase and then decrease again.


Figure 7 shows the effect of load on the peak-to-peak value of transmission error and the amplitudes of the first three mesh harmonics of transmission error for each of three gear pairs. One sees from the peak-to-peak plot that the highest contact ratio gear pair has the lowest values of transmission error throughout the torque range. Also, each gear pair has a low value of transmission error near 454 Nm torque, the torque for which the profile modification was “designed.” There are other minimum regions of each plot, but there does not appear to be any consistency regarding the torque at which these minimums occur. Also, one notes that the highest contact ratio gear pair has the largest number of these minimum regions (in this case, four of them). One sees that the amplitudes of the first mesh harmonic have nearly the same shapes as the peak-to-peak values. However, the higher harmonics tend to have more torques where minimum regions occur. It is interesting to note that at the optimization load of 454 Nm, the predicted transmission error gets lower as contact ratio increases, but at lower loads the middle contact ratio gear pair has higher values than the lowest contact ratio gear pair.
One finds that if we replace torque on the horizontal axis with “effective contact ratio” as is done in Figure 8, the plots take on a slightly different character. First, since at the maximum torque, where the gear pairs run at theoretical contact ratio, the right hand terminus of each plot is the theoretical contact ratio. This accounts for the different lengths of each plot. Second, the spacing between the minima becomes constant and the first minimum for each gear pair occurs at an effective contact ratio between 1.6 and 1.7. The comparison of the different designs at the second and third harmonics reveals an uncanny similarity in the plot shapes. Because of this similarity, subsequent plots of the force variables will only be made versus effective contact ratio.


When we multiply transmission error by average mesh stiffness to get transmission error force, we get the transmission error force plots of Figure 9. However, each of the terms no longer has its maximum value at the minimum load (low effective contact ratio). This is due to the fact that mesh stiffness is lower at low loads due to the reduced contact area.
Figure 10 shows the effect of effective contact ratio (load) on shuttling force. Again, we see minima, but they are at different contact ratios than the minima locations are for transmission error. Again it is interesting that the middle contact ratio gear pair has higher values of shutting force than does the low contact ratio set.


Figure 11 shows a similar plot for friction force. Here, minima are not as obvious, and the force seems to rise fairly consistently as torque is increased.
Figure 12 and Figure 13 show the “sum of forces” plotted, first versus torque and second versus effective contact ratio. We see that the effects of the minima are much reduced, probably because when one force type is at a minimum, the other forces have much larger values. At all loads, the highest contact ratio gear pair has the lowest value, but again at low torques, the low contact ratio pair has slightly smaller forces than the lowest contact ratio pair.


Gear Noise Interpretations
Traditionally, designers have tried to minimize transmission error in order to reduce gear noise. However, the analyses shown would indicate that there are other excitations that may be of equal importance that should be considered. One might ask, why has transmission error previously worked well in this task? One answer is that as we change gear designs to minimize transmission error, we are also minimizing the other excitations. Often we reach a limit where further reducing transmission error no longer causes further reductions in noise, and this is likely a situation where the other excitations are now becoming predominant.
Often, both modelers and experimentalists run data at a single load or a small number of loads. The up and down effect of load on the transmission error force and shuttling force would indicate a danger of false interpretation of such results. For instance, in Figure 9, if we had analyzed or measured noise at one of the minimum loads, and then if we increased the load by 10 percent, we would get a significantly higher value of transmission error force. Hence, a single load data point could be significantly different than a data point taken at a slightly higher or slightly lower load. Therefore, when acquiring either analytical or experimental gear noise data, we recommend that load be varied in a more or less continuous manner.
Conclusions
An approach to merging three of the known excitations of gear noise into a single bearing force metric has been proposed. This metric, which is based on static load distribution calculations, is static in nature so may be used by gear designers prior to performing any dynamic analyses. It has been shown that the excitation predictions are highly load sensitive, so that interpretation of both model results and experiments should occur at a series of loads within the desired load region.
In general, the highest contact ratio gear pair had the lowest values for each of the excitation forces, but at lower loads the medium contact ratio gear pair had higher forces for each excitation than did the low contact ratio set. Future studies will attempt to identify the reasons for this difference.
References
- Houser, D. R. “Gear Noise Sources and Their Prediction Using Mathematical Models,” Gear Design. Manufacturing and Inspection Manual. 1990; SAE, pp. 213-222.
- B–rner, J. and Houser, D. R. “Influence of Friction and Bending Moments on Gear Noise Excitations,” SAE Transactions. 1996; Vol. 105 No. 6, pp. 1669-1676
- Houser, D. R., Harianto, J., and Ueda, Y. “Determining the source of Gear Whine Noise,” Gear Solutions, February 2004, pp. 16-23.
- Vijayakar, S.M. and Houser, D.R., “Contact Analysis of Gears Using a Combined Finite Element and Surface Integral Method,” Proceedings, AGMA Fall Technical Meeting, 1991 and Gear Technology, July/August, 1993, pp 26-33.
- Houser, D. R. and Harianto, J. “Load Distribution Program Manual” The Ohio State University, 1998.
- Drago, R., Lenski, J., Spencer, R., Valco, M., and Oswald, F. B. “The Relative Noise Levels of Parallel Axis Gear Sets with Various Contact Ratios and Gear Tooth Forms,” Proc., AGMA Technical Conference, 1994.
- Houser, D. R., Oswald, F. B., Valco, M. J., Drago, R. J., and Lenski, J. W. “Comparison of Transmission Error Predictions with Noise Measurements for Several Spur and Helical Gears,” Proc., 30th AIAA/ASME/SAE/ASEE Joint Propulsion Conference; Indianapolis, IN. 1994
- Gregory, R. W.; Harris, S. L., and Munro, R. G. “Dynamic Behavior of Spur Gears,” Proc. I. Mech. E.; No. 8. Apr. 1953: pp. 207-226.


