


The cleanliness of steels used for gears is of great importance when looking to improve their life or increase loads. In this paper, carburizing steels with the same basic chemical composition, but with a varying cleanliness level, are compared in regards to cleanliness and performance. Steel cleanliness can be described as size and frequency of non-metallic inclusions in steel, such as Al2O3-MgO particles. Rotating bending fatigue has been used to evaluate the fatigue performance of carburized samples. For this purpose, samples are taken transverse to the rolling direction of the bar, whereas normally, samples are taken in the longitudinal direction. The aim has been to test the method in itself, as well as the most critical loading direction, since this determines the worst-case scenario of the inclusion orientation when forging a gear out of a steel blank.
To determine material cleanliness, a standard micro-inclusion rating method such as ASTM E45 has been used in combination with automated inclusion assessment by scanning electron microscope (SEM) and 10MHz immersed ultrasonic evaluation. The investigations show a good qualitative correlation between fatigue performance and inclusion assessment made by ultrasonic evaluation and SEM. The results also show that traditional micro-inclusion rating methods are not sensitive enough (i.e., the evaluated areas are too small) to give a good indication of material performance. Fatigue testing in the transverse direction of the bar proves to be a good technique that can more relevantly determine fatigue performance of steels for gears without involving costly and somewhat complicated gear manufacturing.
Introduction
As inclusions act as nucleation sites for crack growth under cyclic loading, steel cleanliness is an increasingly important factor for gears as well. This effect can be observed in both torsion/bending/axial loading and contact loading (e.g., gears and bearings). Steel cleanliness can be described as the size and frequency of non-metallic inclusions such as oxides (e.g., Al2O3, MgO, and CaO) and sulphides (e.g., MnS and CaS).
Since the presence of inclusions correlates strongly to fatigue performance, it is essential to have a good enough knowledge of the inclusion population in steel that is used for a critical component.
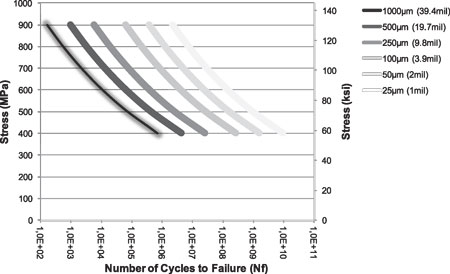
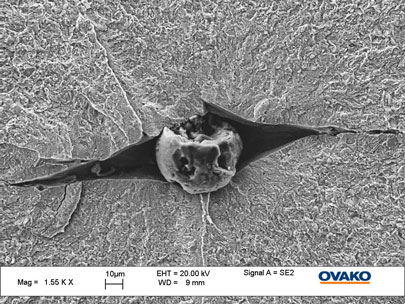
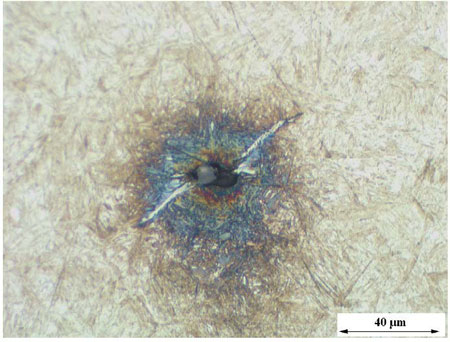
In Figures 1 to 3, examples are presented to illustrate the effect of stress and inclusion size on the number of cycles to failure for hardened bearing steel (∼62 HRC). As can be seen, inclusion size has a dramatic effect on the number of cycles to failure (fatigue performance).
This way of reasoning can be directly transferred to carburizing steels, due to their hardened surface and the fact that high-strength steels are limited by fatigue; i.e., they do not have infinite life.
Background
It is essential to be able to quantify the presence of critical-sized inclusions in steel, since inclusions strongly affect fatigue and therefore the ability to assure product performance. Several methods currently exist to quantify steel cleanliness. For smaller-sized inclusions, micro-inclusions, polished samples are investigated with a light optical microscope (manually or automatically). Examples of such methods are: ASTM E45, DIN 50602, and ISO 4967. Typically, these methods involve examination of areas in the range of 100–1,000 mm2 (0.155–1.55 in.2). It is obvious that these areas are too small to detect infrequently occurring inclusions and therefore cannot be seen to represent the true inclusion population. For macro-inclusions, blue fracture testing, which can still be called for in many specifications, is an inadequate evaluation method for clean steels, since the method is not sensitive enough and rarely finds inclusions. In order to overcome the limitations of such methods, other rating methods can be used to investigate larger areas.
Automatic scanning by the use of scanning electron microscope (SEM) is an alternative that can cover approximately 3,000 mm2 in a few hours. Another way to find less frequent inclusions is to investigate volumes instead of areas, and for that type of examination, ultrasonic inspection is a possibility. It is, however, necessary to be aware that some available standards are not stringent enough to find inclusions in clean steel and that for this method to be useful, many steel suppliers use other limits than specified in current standards.
Investigation
The objective of the investigation was to evaluate the cleanliness and how it is related to the fatigue performance of carburizing steels with similar basic chemistry but with a varying degree of cleanliness, seeing as this type of steel is commonly used for different types of gear applications.

The thesis is that steel cleanliness is considered the limiting factor and will therefore have a larger impact on performance than steel chemistry, as long as they are of similar type. For this paper, different cleanliness levels have been tested, and the chemistry has varied somewhat, although all tested materials have been of a carburizing type steel.
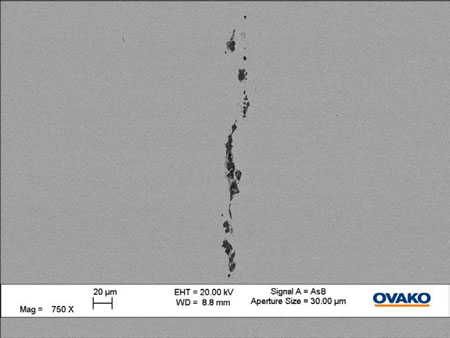
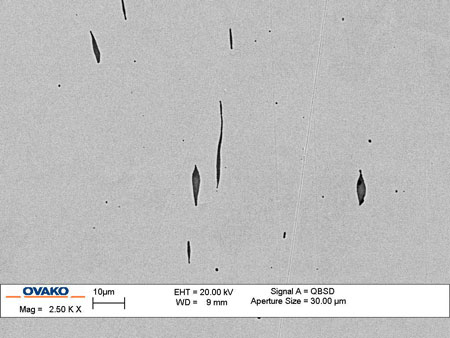
As some inclusion types are deformed or crushed and elongated in the rolling direction (see Figures 4 and 5) during hot working, the result is lower fatigue performance transverse to the rolling direction, compared to the longitudinal direction. This is the main reason for evaluating the transverse fatigue properties, because it is the worst case of the inclusion orientation in a forged gear. Cleanliness evaluation has been performed by using SEM evaluation and 10 MHz ultrasonic immersion testing [1], as well as micro-inclusion assessment. Fatigue performance was evaluated by rotating bending fatigue testing.
Investigated Steel
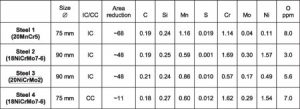
For this investigation, steels from an ingot cast route with higher area reduction as well as steel from a continuous cast route with a lower reduction ratio were included, as presented in Table 1. For all steels, a number of samples has been investigated, and the figures in the report are the results of these tests.
Fatigue Performance
Fatigue testing through rotating bending has been performed (see Figure 6 for setup), in which hourglass-shaped specimens are exposed to alternating tension and compression stresses whilst rotating, thus the specimen is exposed to an alternating stress with an R value of −1 (R = smin / smax). The staircase method was used to evaluate the endurance limit with a maximum number of cycles of 10 million (runout).
Sample Preparation
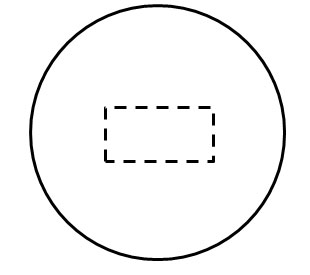
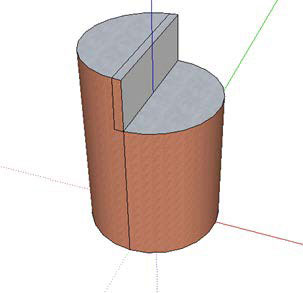
Testing fatigue performance in the transverse direction is normally more challenging than testing the longitudinal direction, due to specimen length being 120 mm, and therefore quite often exceeds the diameter of steel bars to be tested. In this study, the test specimens were produced from bars in the range of 60 mm to 90 mm. The fatigue specimens were manufactured as follows: The center part of the fatigue specimen was cut out from the steel bar (the material to be tested, Figure 7), and turned into a cylindrical sample (transverse orientation).
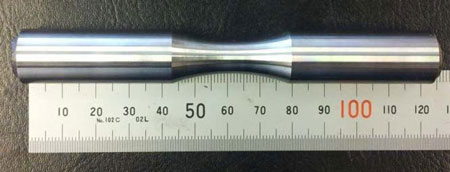
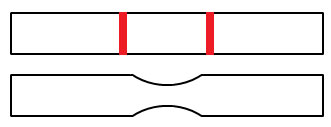
A cylindrical bar with the same diameter was then friction-welded onto both ends of the center sample and then soft-machined close to final shape, see Figures 8 and 9. Heat treatment followed soft-machining, carburizing for approximately 50 hours, in order to get a through hardening. The reason for through hardening is to avoid fatigue failures unrelated to inclusions, for example failures from the transition zone.
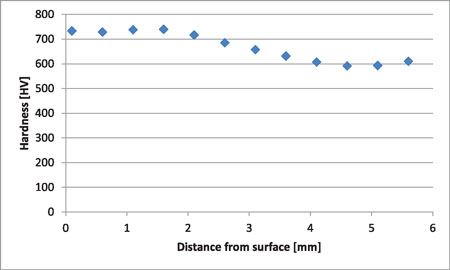
An example of the measured hardness profile as seen in Figure 10, and the surface hardness of the tested samples can be seen in Figure 11.
Results of Fatigue Testing
This paper is based on three sets of tests performed. The initial testing [2] was performed to prove the validity of the method, with friction-welded, through-carburized fatigue specimens. Comparison of steel from different production routes and producers through fatigue testing was then performed to get a deeper understanding of the correlation between material cleanliness and fatigue performance [3].
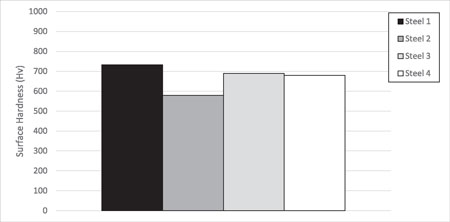
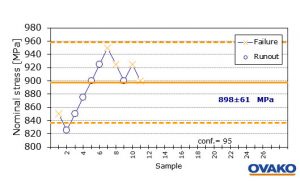
Figure 12 shows an example of the staircase method for rotating bending testing, with a step size of 25 MPa and run-out at 10 million load cycles. For better statistics however, a larger number of samples could be tested.
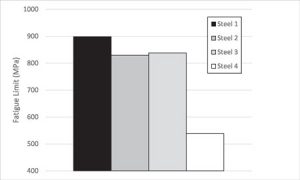
In Figure 13, the summarized results from the rotating bending fatigue testing are presented. The fatigue limit for each material is derived from the results from the RBF testing, with a 95 percent confidence interval.
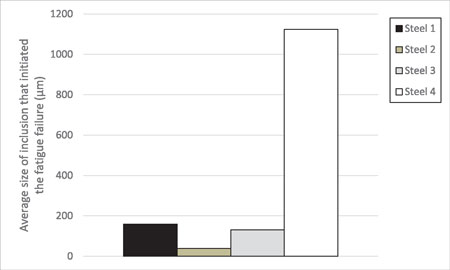
Despite the fact that all steels tested are of similar type, prepared in the same way, with a similar surface hardness and hardness profile (although as shown in Figure 10, Steel 2 has a lower surface hardness than other samples), the fatigue limit varies quite substantially. Steels 1–3 have a significantly higher fatigue limit than Steel 4, and as Figure 14 shows, the average inclusion size initiating fatigue failure is much larger in Steel 4 than in Steels 1–3.
The difference in fatigue limit was made evident in a series production application, where Steel 4 was initially validated for use, to then be changed to steel with a higher cleanliness, due to fatigue failures caused by inclusions. Average size of inclusion that initiated Fatigue Limit (MPa) the fatigue failure (μm).
Steel Cleanliness
The cleanliness of the investigated steels was analyzed in three different ways. First, a traditional micro-inclusion rating method was used, ASTM E45. Second, automated SEM was used, and finally, ultrasonic immersion testing was performed.
Micro-inclusion Rating
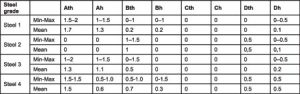
Micro-inclusion rating according to ASTM E45, method D [4] has been used to determine micro-cleanliness.
As Table 2 shows, the micro-inclusion rating gives a very poor indication of the material cleanliness, and based solely on this data, it is very difficult to come to any conclusions regarding what to expect from material performance.
SEM Evaluation
For automated SEM evaluation, a sample was cut out from the center of the bar according to Figure 15, then ground and polished and set up according to Figure 16.
An example of the measured hardness profile as seen in Figure 10, and the surface hardness of the tested samples, can be seen in Figure 11.
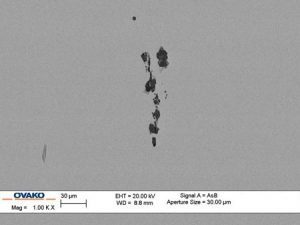
The investigated area is approximately 3,000 mm2, and only inclusions larger than 10 μm have been detected. A simple approach is used to assess tested material: a total number of defects larger than 10 μm per 3,000 mm2 as well as the longest, or largest, inclusion. In Table 3, the results of the SEM evaluation are presented, and as can be seen, Steels 1 to 3 have significantly fewer and smaller inclusions in the examined area than Steel 4. Figure 17 shows an example of oxides present in Steel 4.
Ultrasonic Evaluation
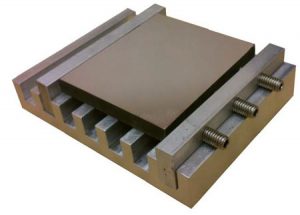
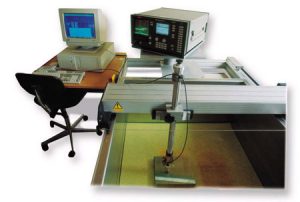
Ultrasonic evaluation has a major advantage compared to other methods used to determine steel cleanliness, namely that with this technique, a volume of steel is examined instead of an area. In Figure 18, the ultrasonic testing equipment can be seen. The steel sample is placed in a tank filled with water, and the testing is carried out by scanning the ultrasonic transducer over the sample, with a specified distance and step size of 0.25 mm.
A 10 MHz ultrasonic transducer was used and calibrated so a 100 percent reflection corresponds to a ∅0.20 mm flat bottom hole (FBH).
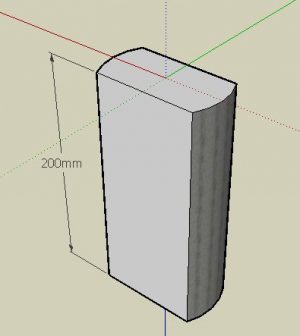
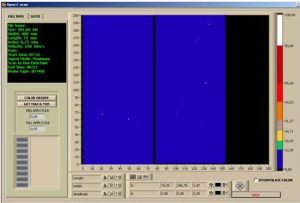
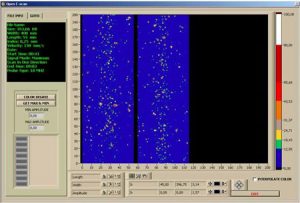
Two samples with a length of 200 mm (Figure 19) from the different steels were evaluated, and the results are shown in Figures 20 and 21 in the form of C-Scans. The ultrasonic cleanliness evaluations reveal that there is a dramatic difference in macroscopic cleanliness between the steels tested.
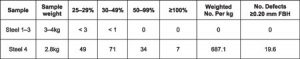
Results from the ultrasonic inspection can be found in Table 4. For the evaluation of inclusion content in the inspected area, a more stringent specification has been developed, compared to the standards currently available, such as the SEP 1927 [5]. This specification has been applied in this investigation, and the results are presented as both a weighted number per kg as well as the number of defects larger than 0.20 mm FBH.
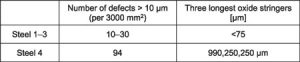
Table 4 clearly indicates that the steels tested have a varying degree of macroscopic cleanliness, where Steels 1 to 3 differ from Steel 4.
Discussion and Conclusions
The aim of this paper was to highlight the correlation between steel cleanliness and expected fatigue performance, based on sampling in the transverse direction, i.e., the most critical loading direction for a gear blank. It was also to make apparent the weakness in some of the commonly used cleanliness rating methods. Micro-inclusion rating, such as ASTM E45 on its own, gives very little information about the material, due to the small area examined.
SEM evaluation generally covers a larger area and gives a better picture of the size and type of inclusions found in the material. Ultrasonic immersion testing, where a larger volume is inspected, provides good data from which assumptions of material performance can be drawn. Rotating bending fatigue testing, which most steel producers use for process and product development, verifies that steel cleanliness does have an impact on fatigue performance.
For applications such as gears, where the loaded direction after forging is quite seldom the longitudinal direction, investigating the transverse direction of steel bars provides much more relevant information about what can be expected from material performance.
However, for series production, using only one of the cleanliness rating methods above is generally not enough to verify fatigue performance.
A combination of micro- and macro-inclusion assessment techniques, suited to today’s cleaner steels such as 10 MHz ultrasonic immersion testing, are being implemented as standard practice at many global automotive OEMs and transmission suppliers, and it is inspection that most steel suppliers can perform in-house on already-existing equipment.
Taking care in the writing of material specifications as well as making use of state-of-the-art technology gives a much more relevant picture of what to expect from your material.
As an additional comment, 10 MHz ultrasonic immersion testing might not be a sensitive enough method to be able to distinguish between clean and ultra clean steels.
Whereas the method works very well for conventional steels, a higher frequency, such as 25 MHz, might instead be used for cleaner steels.
As the investigation shows, steels with a higher cleanliness level — that is, less detrimental defects in the loaded volume — give a higher performance level. These results correspond well to component testing done on gears [6] and can therefore be considered a relevant method of testing for expected material performance.
References
- Ölund, P., 2007, “TB023-2007 Replacing blue fracture testing according to ISO 3763 with Ovako 10MHz immersion ultrasonic testing,” Ovako, Hofors
- Eriksson, K., 2015, “Fatigue testing of 236F, MI-2015-236,” Ovako, Hofors
- Eriksson, K., 2016, “TBL028-2016 Fatigue testing 152D and comp. CC,”, Ovako, Hofors
ASTM, 2013, “Standard Test Methods for Determining the Inclusion Content of Steel”, ASTM E45-13 - DIN, 2010, “Ultrasonic immersion testing method of determining the macroscopic cleanliness rate of rolled or forged steel bars,” SEP 1927:2010-08
- Wallin, K., 2014, “Internal defects in case hardened gears and its influence on fatigue life,” 5th Bodycote/AGA Heat treatment seminar, Sweden


