


Any gear manufacturing company that has worked with the United States military realizes how demanding their requirements can be. That’s certainly the case with Excel Gear, Inc., which is building gearboxes for the control of a missile launch system on the new DDG1000 series of U.S. Navy ships. These gearboxes are the drive elements for the servo systems that rotate and elevate the missile launcher. For good servo performance these boxes must have high stiffness, high efficiency, and low backlash.
The prototype of the gearbox was tested using manual methods. While satisfactory, this method was time consuming and required careful checking to prevent data entry errors. After the successful completion of the prototypes N.K. Chinnusamy, who is the company’s president, decided that improved assembly procedures were desirable for the production run, and that test methods needed to be automated.
The preload of the Timken bearings was identified as an important factor. The result of too little preload is excessive backlash. Too much preload decreases efficiency and results in heat buildup. A measurement accurate enough to determine optimum preload spacer size is difficult because, before the spacer is in place, the bearing can tip from side to side. To prevent this tip, and thereby improve the repeatability of the preloads, a set of fixtures was manufactured (Figure 1). The use of these fixtures improved the efficiency of the first production boxes and reduced their backlash from what had been attained in the prototype boxes. The requirements set for the test system were high accuracy, elimination of measurement errors, and elimination of data entry errors.

Test Types
Temperature tests during run-in: The primary sources of heat in the gearbox are seal friction, bearing friction, and oil churning. The heat produced by oil churning is distributed throughout the box and dissipates through the case. Seal and bearing friction are concentrated and, if excessive, will cause failure.
Temperatures are checked near the bearings on the high-speed shaft, where measurements on the prototype boxes showed that the highest temperatures existed. These areas were also near the seals. Although it isn’t possible to separate the heat generated by the bearings and seals, the seals seem to generate the most heat.
Temperatures were recorded for a two-hour period, with the box running at maximum speed. After a cool down period the test was repeated with the box running in the opposite direction. Temperature rises rapidly at first, and then at a decreasing rate. While the temperatures do not reach equilibrium, in operation the boxes will not run for two hours continuously, and they will reach top speed only intermittently.
Gear train stiffness: Stiffness is defined as the ratio of the motion of the input shaft to the torque applied with the output locked [N m/radian]. Torque was applied using a hydraulic actuator. The actuator has two opposed cylinders driving two racks against a pinion. The racks are held in the pinion by a bushing. This results in friction force opposite to the direction of motion. Because this friction in the hydraulic actuator would cause measurement inaccuracies, the torque is measured between the actuator and the input shaft using a DATAFLEX 42/1000 torque transducer.
This transducer has a capacity of 1,000 Nm in either direction. The torque is determined by measuring the twist in the transducer shaft using rotary encoders in a differential circuit. One encoder rotor is mounted at each end of the shaft. Since the encoder read heads are mounted to the stationary part of the transducer, there are no slip rings. The A quad B output from the transducer is converted to a voltage by an encoder electronic box. The voltage output range is 0-V to 10-V with a no load value of 5-V, and the calibration constant is 0.200-N m/mV.
Rotary motion was measured using a 2,000 line rotary encoder (resolution of 0.018-deg). Because the input shaft extends through the box, the encoder is mounted on the opposite end of the shaft from the hydraulic actuator. When the box is in operation, a brake is mounted on this end of the shaft. The A quad B output from the encoder is converted to a voltage by the encoder control box, which is programmable. The range and number of volts per degree can be set depending on the amount of rotation to be measured. The output has a range of 0-V to10-V. For this test, the output was 8.100 -deg/V and the no rotation voltage was 5-V.
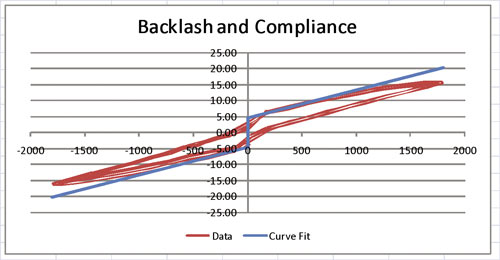
Gear train backlash: Some backlash is necessary to provide running clearance for the gears. Too little backlash results in overheating and premature failure, and too much degrades servo performance. The backlash is determined from the same data collected for gear train stiffness (Figure 4).
Breakaway torque: This test was the only one not automated. The breakaway torque for these boxes was very low. It was measured manually using a snap type torque wrench. Although automated tests are usually desirable, a few tests are so simple that the programming required is not justified.
Gearbox power losses over the full range of speeds: Input torque was measured with the gearbox running at a set of speeds in both the clockwise and counterclockwise directions. The torque was a nearly linear function of speed with a very small component of stiction. This is highly desirable in a servo system since it contributes to servo loop damping. Because the torque is nearly a linear function of speed, the power loss curve is nearly parabolic.
Test Equipment
The test equipment is shown in Figure 2, Figure 2b, Figure 2c and listed in Table 1. The software used is a graphical programming language named DASYLab. This software is programmed by placing block diagrams representing data collection operations on a screen and connecting them with “wires” to control data flow. In the system used here, the processed data was written to disk in tab-separated format suitable for further analysis using Microsoft EXCEL.


Programming the Data Collection System: Figure 3 shows a DASYLab programming screen. Each block represents an operation on the data such as collecting, scaling, saving on disk, displaying, etc. This method of programming is much faster than writing code. The voltage output from the torque transducer, encoder, and thermocouples was connected to the electronic interface box. This box has a built in reference junction for the thermocouples. The device also has digital and analog output capability but these were not used in this testing. The interface box scans its inputs and converts from analog to digital values. These are passed to the computer through a USB connection at a rate of about 1-Hz. This is relatively slow for data acquisition, but more than adequate for these quasi-static tests.

In the DASYLab program, the first box is an input box that “talks” to the hardware and places the input values on its outputs in digital form. Typically this is a special module that works only with particular hardware. Most other boxes do not depend on the type of hardware in the system. The other boxes used are numerical displays, graphical displays, and output boxes to record the data on disk. These boxes have corresponding components on a display screen. This screen can be a virtual instrument, i.e. it can look like a voltmeter, oscilloscope, chart recorder, etc.
For this testing the program converts the inputs to engineering units and displays the values in a number of ways. Digital displays show the current numerical values of inputs. Another display is an XY-plot that shows rotation on the Y-axis and torque on the X-axis. This type of feedback gives a preview of results. It can save much time because if something is wrong — e.g. broken wire, failed thermocouple, etc. — it is quickly apparent. The test can be stopped, the problem corrected, and the test resumed. If a problem is not recognized until the data is being analyzed, the entire time of a test is wasted.
One disadvantage of DASYLab is that this program had to be written with the computer attached to the interface hardware. It would be a great advantage to be able to write the program sitting in front of a desktop computer rather than working in the test area using a laptop.
Analysis Details
Backlash and Compliance: One of the advantages of automated data collection is the ability to collect a larger amount of accurate information than can be collected manually in a reasonable time. The additional data gives a better picture of the equipment characteristics than would otherwise be possible.
In Figure 4 the red line simulates the points collected when the torque was varied from zero to maximum, to minimum, and back to zero three times. (To protect customer confidentiality, the data shown are not actual values but they are an accurate representation of the type of data collected.) The data showed very good consistency and repeatability, which produces a high degree of confidence in the results.

The blue line shows the curve that was fit to the data for the backlash and compliance. The length of the vertical line at zero-load is reported as backlash. The slope of the lines fitted to the observations is the stiffness. This method of determining these values is very conservative. The normal manual four-point test would have given both lower backlash and compliance numbers. The four-point test uses two torques that are just a little higher than breakaway torque in each direction and two torques that are a quarter to one half of the full load torque.
Converting from manual to automated testing: The first use of an automated system involves debugging, i.e. the test system, as well as the tested device, may have problems. An advantage in starting this system was that previous manually collected results were available for reference. Problems with the test system could therefore be seen quickly.
For the first test, some of the manual measuring devices were used in parallel with the new test equipment. This either verified the results or showed the problem. For example an incorrect scaling factor was quickly detected and corrected. This illustrates one of the principles of successful testing: Check the calibration of the test equipment before running the tests.

Figure 5 shows the encoder (in center connected to electrical cable) for the automatic system and the inclinometer (mounted on the horizontal bar) used for the manual readings. The encoder has better resolution, but a difference between the two devices would quickly show any scaling or programming errors.


