


Over the years, there have been many claims made concerning the relative noise performance of austempered ductile iron (ADI) versus steel as a gearing material. This paper presents results from a systematic experimental study to ascertain these differences. A back-to-back test rig was used to run speed sweeps at multiple loads of profile-modified spur gears. Speed sweep data over a broad speed range was analyzed using the Vold-Kalman filtering procedure to make comparisons between the two materials. Also presented are predictions based on measured tooth topographies of the transmission error and “sum of forces” gear noise metrics. These predictions show that the iron gears should be slightly quieter than the steel gears at loads beneath the transmission error optimization “notch” torque and slightly louder above this torque. The laboratory measurements show that the iron gears are on average slightly quieter (0 to 1.5 dB) than the steel gears, but at some conditions, the steel gears are quieter than the iron gears. However, the measured differences are very small, with the values being beneath the noise difference detectable by the human ear and also beneath the measurement accuracy and repeatability of the experiment.
Introduction
For years, austempered ductile iron (ADI) has received many claims that it may be a suitable replacement for steel in many gear applications [1-6]. Among the claims often made for ADI is that it offers noise reduction benefits relative to steel. This paper will examine these claims using both computer modeling and testing under laboratory test conditions.
This paper will first discuss the general topic of gear noise, including types of gear noise and the primary sources of the noise. This will be followed by a discussion of a few previous studies of the noise of ADI and cast iron gears. Comparative results of gear excitation modeling are then presented to show how predictions differ between steel and ADI gears. An experimental procedure using Vold-Kalman filtering [7] for making comparative noise studies of gear materials over a broad range of operating conditions is developed and utilized. The results of the tests are presented and indicate that the ADI material does provide a slight reduction in gear whine noise generation over a broad range of torque and speed conditions.
Gear Noise Generation
Figure 1 shows the flow of information that occurs when generating gear noise. Gear noise is initiated at the gear mesh where motion errors in the mating teeth cause vibration excitations of torsional/lateral vibration of the meshing gear teeth and their supporting shafts. External torques from the driver and driven bodies may also excite the gear mesh. The response of the gear dynamic system to the excitations results in forces at the bearing that, in turn, excite vibrations of the gear housing. These vibrations of the housing panels act much like loudspeakers in generating gear noise. Structural and acoustic resonances are present in virtually each of the blocks of the diagram, and there is most likely dynamic coupling between the blocks. The only resonances that might be affected by a change of gear material are those that occur in the first two blocks where, when one goes from steel to ADI, both the mass and the stiffness (modulus) of the material reduce by about 10 percent. These reductions being roughly the same, however, will have little effect on natural frequencies that involve the gear rotations and translations.

The next issue to be decided when evaluating a gear noise problem is to establish the type of gear noise that is being experienced. Gear noise may be broken into the following types [9–11]:
- Gear whine is a tonal sound that is related to the gear mesh frequency that, for a simple gear pair, is calculated by taking the product of the number of teeth multiplied by the shaft speed. The whine sound that is heard is the composite of the sounds generated at the gear mesh frequency and its multiples, which are called harmonics, and may include modulation frequencies called sidebands. The main excitations of gear whine are transmission error, which is the rotary motion error between the pinion and the gear, force axial shuttling, which results from an axial shifting of the centroid of the mean tooth force (most important in helical gears) [12] and the mesh friction force that is the product of the mesh normal force and the meshing coefficient of sliding friction. This friction force is usually of a secondary nature, unless the gear designer has done an excellent job in optimizing the gear profiles to minimize noise, in which case the friction force may be quite significant. Sometimes mesh stiffness variation is mentioned as a source, but since transmission error at load is influenced by mesh stiffness, it is difficult to separate the individual effects of each, but transmission error can be used in such a manner that includes both the effects of motion errors and mesh stiffness variations. Each of these effects is heavily influenced by the gear microgeometries (lead and profile design deviations), so it is vital to have an understanding of the gear profile and lead modifications and their manufactured accuracy.
- Gear rattle [13] occurs when the gear teeth come out of contact and then impact one another when they come back into contact. When this type of noise is present, it is most often caused by an external torsional excitation that occurs at one of the lower harmonics of shaft frequency. These excitations usually come from either the driving member (motor, engine) or the driven member (pump, generator, etc.). Examples of sources of rattle excitations are the firing frequency of an internal combustion engine or the number of pistons of a piston pump. These excitations may be of such an amplitude that the gear teeth lose contact and then come back into contact with an impact that results in a clattering type of sound. Unlike gear whine, rattle does not have a characteristic frequency, as the sound is a composite of the impact responses of the gear blanks and supporting structures.
- Gimmick sounds incorporate a variety of sounds, examples being those resulting from nicks on the teeth or squeals coming from the sliding of like-material plastic gears.
Literature Review
In this review, the claims of papers in the literature are discussed in light of the Figure 1 schematic and the above discussion of noise sources. Often, claims made about the quietness of cast iron and ADI gears are based solely on the fact that cast iron/ADI has significantly more damping than steel; hence, when one hits the ADI gear with a hammer, its ring downtime is shorter than that for steel. These claims have been made by O’Rourke [14] and Breen [6]. Damping only affects responses in and around resonances, so any impact phenomena such as the gear rattle response should have a different character for the heavier damped ADI material. There is the thought that damping does affect gear tooth natural frequencies, but these frequencies, which are also affected by the slight reduction of the material density of ADI, are so high — usually greater than 50 KHz — that they are above the range of human hearing and are only excited at extremely high rotating speeds of the gears.
With regard to gear whine, damping could have an effect when the excitation frequency matches a resonant frequency, but this would occur at isolated speeds and not across the total speed range of a gear pair. There have been some tests to evaluate whine noise comparisons between steel and ADI [6, 15], but they usually have been run at a single speed and do not cover a broad range of torque and speed operating conditions. Since gear whine is extremely dependent on the shape of the profiles and leads, and if one is serious about reducing noise, it is common practice to optimize these shapes in an effort to reduce the noise. If this optimization is done, it is likely that the shapes would differ between the two materials, due to the modulus difference between the materials.
O’Rourke and Grander [14] comment that the precipitate particles in the iron create roughly twice the damping as occurs in steels. However, they present no data to indicate that this has an effect on noise.
Pokrovskii [15] presents single frequency spectra between different types of cast irons and steel. However, his results show one of the difficulties of making comparisons at single speeds as one observes up to 30 dB differences in noise, which is probably due to a shifting of resonances. Also, it is difficult to identify the mesh frequency harmonics in their data. They do draw conclusions that the high speed cast iron is up to 3 dB quieter than steel in one instance, but nothing is mentioned about the nature of the profiles of the teeth differing from one material to the next. The main question is: How do we know whether the quieter iron gear pair, just by chance, has a more optimum profile than the steel gear pair, thus bringing up the possibility that the reduced noise might be due to a different profile of the iron gear pair?
Harding, et al [16] report on the work of Lottridge and Grindahl [17], Hornung [18] and Johansson, et al [19] reported that ADI gears are one grade quieter on a 10-point scale, but little information on the testing conditions is provided. Likewise, Hornung presents data at three speeds that shows ADI to be from 6 to 9 dB quieter than steel, but again, no mention is made of the profiles of the teeth. Johansson, et al [19] mention that ADI gears have a lower coefficient of friction than do steel gears, hence providing rationale for having lower friction forces that are a secondary source of gear whine noise.
Brandenburg, et al [20] present damping differences for several materials and also show information from the report by Breen and Doane [6].
Breen reports data from Hornung and Hauke [21] showing axle gear speed run-ups from 1,400 to 4,000 rpm, where the ADI gears have gear noise of roughly 6 to 9 dB lower than that of steel gears. Breen also reports on steel-ADI gear noise comparison made from testing 14 gear pairs in a gear fatigue test rig. The sum of the first three harmonics of mesh frequency was provided as a measure of noise level. There was approximately a 6-dB variation from gear to gear (noisiest to most quiet) of seven pairs of each material, and there was little difference between average noise levels. The recommended approach of measuring the profiles of each of the sets was performed for two of the sets, and predictions of transmission error were made so as to relate to the aforementioned noise measurements. The profiles were significantly different between the ADI and steel to such an extent that based on transmission error differences, the ADI gears were predicted to be from 7 to 11 dB louder than the steel gears, while the measurements for these two sets of gears showed the ADI gears to be from 1 to 3 dB higher. Therefore, one could draw the conclusion that, all things being normalized to transmission error, the ADI gears are from 6 to 8 dB quieter than the steel gears. Again, however, because of the single speed of running, one does not know whether resonances had any effect on the results.
Based on the above, rather incomplete results, it was decided that more detailed study needed to be performed of the comparisons between ADI and steel gear noise performance using carefully designed and measured gear profiles of both the ADI and steel gears.
Design and Procurement of Test Gears
Two pairs each of 8620 and ADI gears were designed and then manufactured using a generation grinding procedure. The AGMA 8620 steel test gears are versions of the AGMA tribology gears [22] used to generate the data for AGMA Technical Paper 06FTM08 [23]. These gears were reground with new tip reliefs, and identical modifications were applied to the newly cut ADI test gears. The profiles are such that the minimum transmission error optimization torque is in the middle of the torque range of the FZG gear tester used for the study. Interestingly, the optimization torque will be different (see the next section) for each material due to their having differing moduli. An alternative approach would have been to provide a slightly larger amount of tip relief on the ADI gear pair and thus have the optimization torques the same for each material. However, there still would have been a difference in the TE-torque relationship of the gears, due to a difference in the no-load transmission errors. Profiles and leads of one of the pairs of each material are given in Figure 2 and Figure 3, respectively, and show that the gear pairs have nearly identical topographies.


LDP Simulations Using Design and Measured Topographies
LDP is a gear simulation program developed at The Ohio State Gear Lab that predicts the levels of gear noise excitations such as the forces due to transmission error (TE) and time varying friction [24, 25]. Figure 4 shows the mesh frequency transmission error versus torque for the design profiles that are identical for both the steel and ADI gear pairs. The figure shows that the optimization torque for minimizing transmission error is 2,000 lbf-in for the steel material and is 20 percent less for the ADI material that has a 20 percent lower modulus. A second excitation called the sum of forces [6, 26] essentially adds the mesh harmonic effects of transmission error, friction, and shuttling force to provide what is felt to be a more realistic physical assessment of the noise excitation, and in terms of the information flow of the Figure 1 block diagram, would be the force applied at the bearing/housing interaction block. Since the transmission error force is dominant, the shapes of the plots of the two figures are quite similar because the transmission error force is larger than the friction force across most of the torque range, and the shuttling force is virtually zero for spur gears. Differences in the two plots occur at extremely low torques, where the lower mesh stiffness of the gear pair results in lower forces and at torques near the optimization torque where the friction force raises the transmission error force from the near-zero value that occurs for transmission error. In both figures, the ADI gear excitations are lower than the steel excitations when the torque is beneath the optimization torque and are greater that the steel excitations when the torque is greater than the optimization torque. The bold arrows of the figures show the torques that were used in the subsequent testing. Since most noise problems exist beneath the design torque, two torques were chosen in that region and one was chosen at the optimization torque. Above the optimization torque, where the fourth test point was chosen, is where there is full contact across the tooth flank, and tip interference occurs due to tip relief being inadequate to totally compensate for the mesh deflection.


Figure 5 shows a plot similar to Figure 4 except that here, the measured topographies were used. “ST” stands for the steel gears and AD for the ADI gears. Since two pairs of test gears of each material were machined, two different sets of topographies for each material were analyzed and are the reason that there are two traces of each material. The differences in the traces presents a representation of the manufacturing and or measurement repeatability. The topographies used in the simulation were averages of the measurements of four teeth. Four sets of simulations were performed as if all of the teeth were the same as each of the individual measurements pairs, and the variation was even greater than that shown in the figure. The major difference of the actual modifications relative to the design modifications is that they have lower optimization torques, while the shapes of the curves remain almost identical. This means, however, that when looking at the experimental torques, there is now only one torque beneath the optimization torque, one torque at the optimization torque, and two torques in the region of insufficient tip relief.


Generally, as one goes to higher harmonics, predictions tend to have much more variation, as is indicated in Figure 6, a plot for the second harmonic of mesh frequency transmission error. The higher harmonic predictions are important because they are often at the frequency of highest noise, and perhaps most importantly, they are easy to break out in the type of experiment used here, so they allow for additional sets of data to compare the materials to without needing additional experimentation. It is interesting to note that the second harmonic’s value at the first harmonic optimization torque is near its maximum value. Interestingly, at torques beneath the first harmonic optimization torque, the transmission error of the ADI gear pairs is higher than that of the steel gear pairs, with the reverse being true above the optimization torque. Figure 7 shows the “sum of forces,” a metric for the mesh frequency harmonic of the analysis of the measured gear pairs. As with the transmission error plot, the optimization torque is much lower than for the design modifications.

Because noise is normally plotted using the logarithmic dB scale, Figure 8 replots the Figure 5 data logarithmically in terms of force dB on the vertical axis in order to see the predicted shifts in units comparable with the noise dB. It is interesting to note that the differences for the pairs of the same material gears in the low torque range are almost as great as the differences between materials. In terms of dB, the ADI gear pairs are predicted to be from 1 to 4 dB quieter than the steel gear pairs at low frequencies and from 1 to 3 dB noisier than steel above the notch. Differences in the notch region are as great as 6 dB. As load increases, the differences between materials drops to 1 dB at the highest torque, and the effects of manufacturing differences virtually disappear.


Figure 9 and Figure 10 show similar logarithmic plots of sum of forces for the second and third harmonics of mesh frequency, respectively. As with the mesh frequency predictions, the differences in sum of forces predictions for both the second and third harmonics tend to flip-flop at a transition frequency, with predicted noise of the ADI gears being less than steel at the lower frequencies and higher than steel above the transition frequency. The second harmonic differences between materials tend to be quite low.
Test Setup
The FZG tester used for these tests is shown in Figure 11. The test gear set has a 1.5 ratio with 20 teeth on the pinion and 30 teeth on the gear (see Table 1 for geometry specifics). The pinion and gear of the slave gearbox have 16 and 24 teeth, respectively, thus the mesh frequencies of the two sets are different by 20 percent. For instance, when the pinion speed is 2,700 rpm, mesh frequency of the test set is 900 Hz while mesh frequency of the slave set is 720 Hz. When a spectrum analysis of the signals is performed, the effects of these two sources will show up at different frequencies, thus allowing the separation of their effects. Another advantage of the back-to-back configuration is that the torque may be locked into the loop, thus making for easy and controllable torque application.


- Two fixed-location microphones located at distances of 3 feet and 6 feet from the test gearbox, respectively. Both microphones have a calibration of 35.6 mv/Pa.
- Two housing accelerometers — one on the top plate and the second on a bearing cap. The top plate accelerometer has a calibration of 9.98 mv/g, and the cover accelerometer has a calibration of 10.02 mv/g.
- A tachometer that was used for order tracking during a controlled two-minute speed run-up from pinion speeds of 0 rpm to 2,700 rpm. The test rig is located in a reasonably reverberant room, where reflections and room resonances can affect the noise measurements. However, the main focus of this study is to make relative measurements with the microphones remaining in precisely the same locations for each test in such a manner that local acoustic resonances do not flavor the differences in the data taken for the two materials.

A waterfall plot of a sample speed run-up is shown in Figure 12. This plot shows a superimposing of individual frequency spectra that are generated as the speed of the gearbox is increased. The large peaks that appear on the diagonals are harmonics of mesh frequency (obtained by multiplying the number of teeth times the shaft speed). In this case, mesh frequency of the test gear pairs is tracked by the first red cursor on the left, the next red cursor tracks twice mesh frequency, and the third cursor tracks the third harmonic of mesh frequency. Other, higher harmonics are also visible as are the harmonics of the slave gearbox, with mesh frequency being a diagonal line of peaks to the left of the mesh frequency cursor and the second harmonic of the slave gearbox occurring midway between the first and second harmonic cursors of the test gear pair. When there is an elevated region that occurs at the same frequency for each spectral plot, as occurs between 1 and 1.5 kHz, this indicates the presence of one or more system-natural frequencies. A problem with using waterfall plots is that the harmonic peaks are not continuous between individual spectra, and there is considerable variation of peak amplitudes with time. An alternative to the waterfall plot is the Vold-Kalman filter [7] approach that digitally simulates a tracking filter that “tracks” a chosen harmonic of either shaft or mesh frequency.


In this study, order plots were used to assess the noise and vibration levels across the entire frequency range excited by mesh frequency and its second harmonic at twice mesh frequency. Order plots are projections of the waterfall plot’s harmonic cursors to either the RPM axis or the frequency axis. This author prefers reflecting to the frequency axis, as is shown in Figure 13 and Figure 14. This figure, which was created using VSI Rotate [27], has a logarithmic vertical axis in which the dB value is referenced to the sensor volts and not a noise level or vibration level. When taking differences, like we are doing here, the differences in dB will be the same, whether the reference is volts, vibration, or sound pressure. The mesh first harmonic is the 30th order (30 teeth on the gear); the 60th order is the second harmonic, etc. In this case, six harmonics are shown in Figure 13, and four harmonics are shown in Figure 14. It is interesting to note that as one goes up in harmonic number, one peaks out at higher frequencies of the noise. In this format where frequency is on the horizontal axis, one observes that the highest frequency of first harmonic is only 900 Hz, the highest frequency of the second harmonic is 1,800 Hz, etc. An advantage of this type of format is that one may observe the relative system dynamics of each harmonic, and if linearity exists, one should see the same resonances occur at the same frequency for each harmonic. This is pretty clear for the vibration data of Figure 14 where, at roughly, 400 Hz there is an obvious resonance that is excited by each of the harmonics.

Also, one can get a feel for the relative level of excitation of noise of each harmonic, noting that the y-axis is in dB, so the spacing between each harmonic is the difference in excitation level in dB. In simplified terms, if we normalize to the fourth harmonic, the Fourier series components of the excitation going from mesh frequency to the fourth harmonic would respectively be 44.7, 11.2, 4, and 1.0. Figure 15 shows the effect of torque on the third harmonic of gear noise, another interesting view of the relative excitations of gear noise. Here, all data is for the third harmonic of mesh frequency, and again, several natural frequencies match at different speeds. This plot may also be compared with the noise excitation prediction shown in Figure 12 where the bearing force excitation prediction shows an increase of about 25 dB when one increases the torque from 50 Nm to 250 Nm. The increase shown in Figure 15 for the same torque range is 24 dB at 2,400 Hz; 23 dB at 1,400 Hz; and 15 dB at 900 Hz. The comparison is exceptional at the higher frequency, but there does seem to be a nonlinear torque effect with speed for this particular data.
Preliminary Runs
Initially, numerous tests were run at constant loads and speeds, and measured frequency spectra of noise and vibration were used to come up with mesh frequency noise and vibrations and to get similar results for the mesh harmonics. Sometimes the difference in noise between ADI and steel were as high as 10 or 12 dB, and at other conditions, it might have been a negative 12 dB. This was very discouraging since the differences between materials were projected to be in the range of 1 to 4 dB. Measurements by Drago et al [27, 28] on aerospace quality gears showed that their assembly deviations caused noise amplitude shifts of up to 3 dB. To get variations down to these levels, a thorough assessment of assembly procedures was undertaken, and it was found that significant bearing preload variations occurred. To correct this, adjustments with bearing shims and the side panel gaskets of the gearbox were implemented. It was also decided to restrict testing to the speed run-up procedure and compute average sound differences across a broad frequency range for each of the harmonics of the measurement microphones and accelerometers.
Speed Run-Ups
More than 70 speed run-ups and about 1,300 harmonic analyses were performed on the four pairs of gears. For each mounting of a gear pair, four torques were analyzed for up to 8 harmonics of mesh frequency. The following outlines the experimental and data analysis procedures:
- Run 2-minute speed run-up from 0-1,800 rpm of the low speed shaft (2,700 rpm at the high speed shaft). Record data from the five sensors on a DAT recorder.
- To assist in solving the repeatability problem, three repeat runs that required remounting and re-applying load to the gears were performed for each of the four test loads. Figure 16 shows a typical three-run repeatability result for twice mesh frequency (order 60, second mesh harmonic) where the lower part of the legend shows the values at the cursor located at an obvious resonance of unknown nature. One sees that the variations range from zero to roughly 4 or 5 dB, and under the cursor, the three values are -88.5dB, -90.9 dB, and -89.2 dB — a range of 2.4 dB. Figure 13 shows a similar plot for the mesh frequency order of one of the accelerometers. Here, the variability is as high as 5 dB, and the variation is particularly noticeable at frequencies above 600 Hz.
- Gears were tested at low speed shaft torques of 82, 143, 199, and 302 Nm. These torques were changed without remounting the gears. They were selected based on LDP simulations, two of them being below the minimum notch of the transmission error prediction, one near the notch, and one above the notch load. However, following analyses with measured topographies, the optimization torque changed, so that only one torque was beneath the optimization torque.
- Convert the raw data to Universal file format for analysis with VSI Rotate, a proprietary dynamic data analysis software program.
- Use the Vold-Kalman filter procedure of VSI Rotate to extract the amplitude of the orders of the data [3]. Because subtle differences between the gears will have their greatest effect at higher orders, only the first two orders were used in the analysis. This allows comparisons of gear noise generation up to 1,800 Hz.
- Determine frequency ranges where the order data is greater than the noise floor by comparing the mesh order to adjacent off-mesh orders. As an example, Figure 17 shows comparisons of orders 60, 60.5, 61, and 61.5 from one of the accelerometers. With the exception of a small range of frequencies in the 900 Hz range, the order 60 data is usually 4 to 10 dB higher than any of the adjacent orders indicating that the 60th order data is valid for these frequencies. A similar analysis was done for each of the transducers for both the 30th and 60th orders. In all cases, a bandwidth of 1⁄2 order and a smoothing factor of 10 was used for the final data collection. In almost all of the data, the noise floor only affected low frequency data; in this case, valid frequency ranges are above 250 Hz for the mesh order (30th harmonic) and 450 Hz for the 60th order. Had higher orders been used, the data was valid above 700 Hz for order 90 and 1,000 Hz for order 120. The reason the frequency goes up with order is because the excitation level goes down with increasing mesh order.
- Two means of analyzing the data were used:
- Compute the average levels at each frequency of each material across the acceptable frequency range, take the differences at each frequency, and then compute the average difference. We decided to take differences and averages using decibel values as opposed to absolute values because the differences are quite small, and this simplifies the analysis procedure. Later, the data was converted to engineering units, and the differences were repeated, with little change occurring in the results.
- Pairing the three runs such that three sets of differences were obtained, so that there was the possibility of using paired tests. This also allows for obtaining standard deviations for the material noise or vibration differences. A summary of the analysis results is presented in Table 2. This scheme might also correct for any time trends that might occur in the data taking, since each of the paired results were taken in simultaneous test runs. Figure 18 and Figure 19 show results of a couple of the paired analyses that were copied to a spreadsheet where the differences were evaluated. In each figure, there is a striking similarity of the traces for the two materials, yet at some frequencies there are subtle differences of 2 to 4 dB. There are also situations where one material is noisier (higher in the y-axis) at one speed/frequency, and at another speed/frequency, the other material is noisier. However, looking at the overall scheme of things, it would appear that the ADI gear pairs are slightly lower in vibration and sound level than the steel gear pairs.

ADI gears.


Discussion of Test Results
- For the three run average plots shown in Figure 20–Figure 21, it seems that one torque has the highest noise level at one frequency and another one does at other frequencies (data invalid due to poor signal to noise beneath 400 Hz).
- Torque level has a greater effect on noise and vibration levels for the twice mesh frequency order than it does for the mesh frequency order. This is not borne out in the ldp predictions.
- There is a lot of variation in the excitation torque effect with speed. For instance, for transducer 2, the torque variation ranges from 5 dB to about 20 dB as a function of speed.
- For mesh frequency, little sense can be made out of the effect of torque on noise, while for the second harmonic, for most frequencies, the higher the torque, the higher the noise, which is pretty consistent with the LDP predictions.
- The average speed run-up comparisons for the two materials always have very similar shapes as a function of speed and quite often look nearly identical, except for a few isolated frequency regions. An exception was transducer 3, which had quite a bit more variation.
- The difference in noise level plots show a lot of variability with speed, and the general trend is that for most of the frequencies, the ADI gears are quieter than the steel gears, with the biggest difference being at the lowest torque. In order to get a cleared trend of the effect of torque on noise level, we recommend running a series of tests with a much finer torque gradient.


Presented in Table 2 are the summary results calculated in the spreadsheets for three of the transducers for the four torques. The valid frequency ranges based on signal-to-noise ratio were used for both the first mesh harmonic and second mesh harmonic data to come up with a single average value. As discussed later, the TR3 accelerometer was not included in this analysis because of high values of standard deviations between runs for this transducer. As expected, the decibel differences are similar from one transducer to the next, with the worst variation being about 0.9 dB for the 199 Nm torque value.
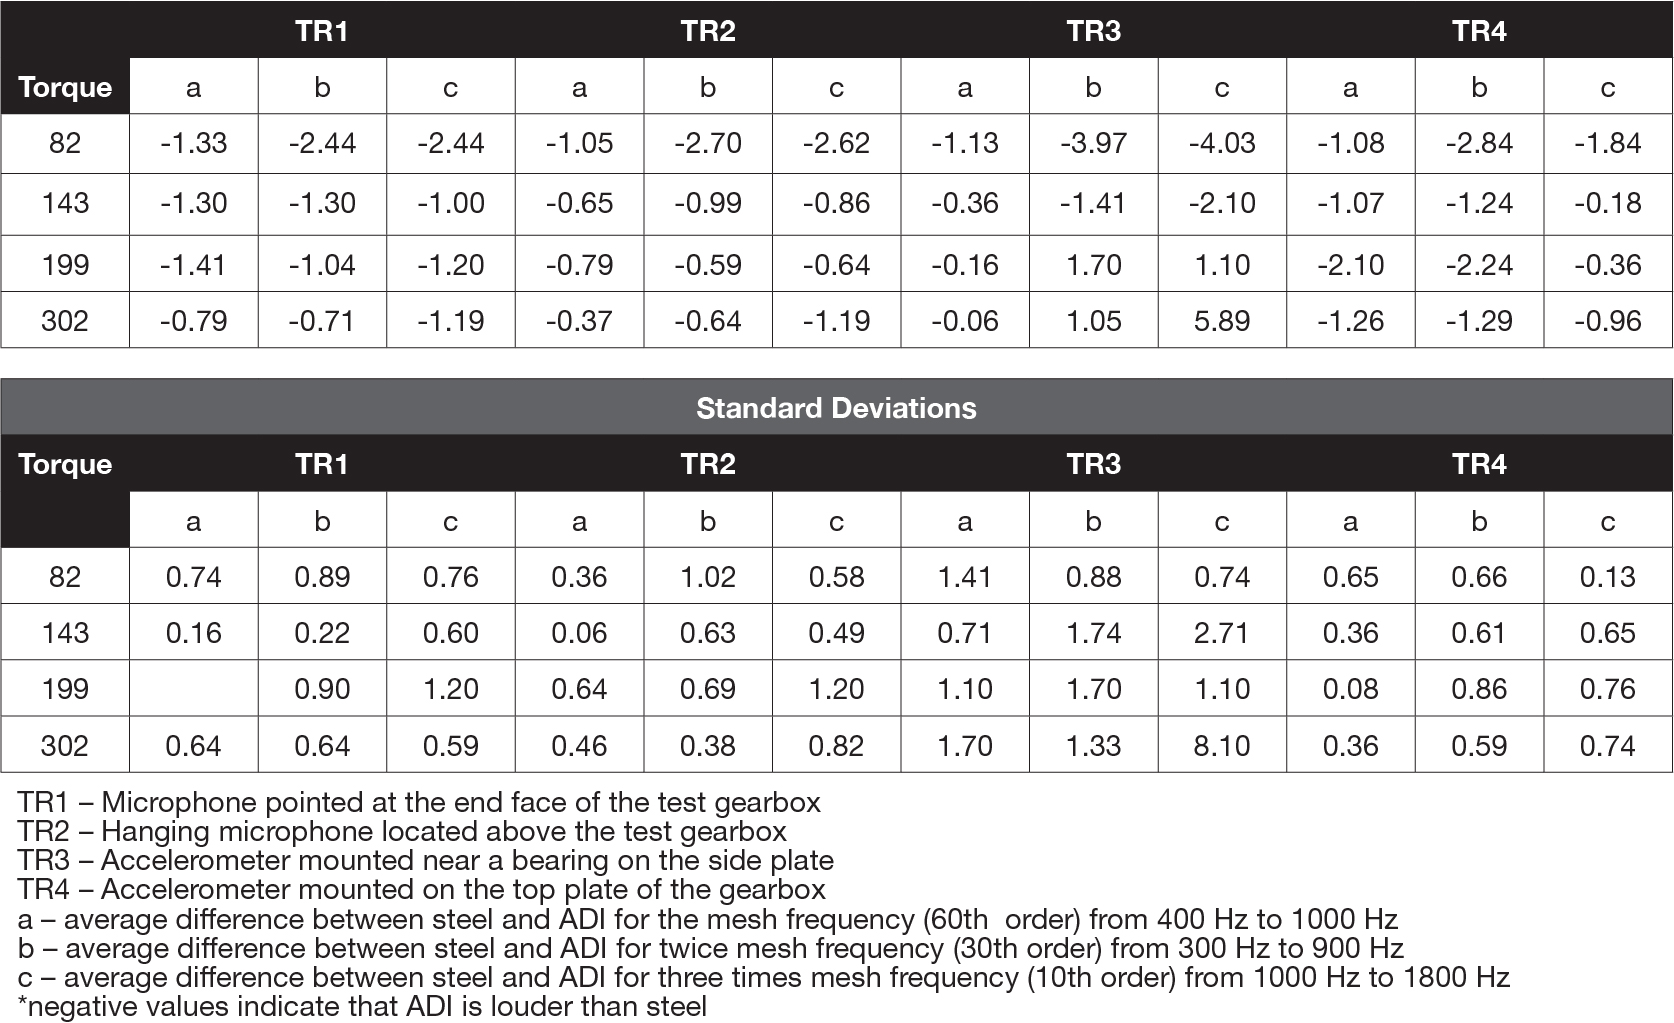
Presented in Table 3 are the mean differences between the ADI and steel materials, as well as their standard deviations for all four transducers. In early data runs, it was noted that there might be a difference in the low frequency data for the second mesh harmonic relative to higher frequency data, so the data analysis split the second harmonic data into two frequency regions defined as b and c, respectively, with b being from 400 Hz to 1,000 Hz and c being from 1,000 Hz to 2,000 Hz. The “a” data is for the mesh frequency harmonic that goes from 350 to 1,000 Hz. Each of the mean values is the average of the three runs at that condition (similar to Table 2 results, only with different frequency ranges for the calculations), and the standard deviations are computed from the differences computed for the three runs. Using only three repeat test runs provides a relatively small sample for computing standard deviations, but due to the time to remount gears and analyze the data, it was felt to be much better than running only a single run that has normally been done in most reported gear test data in the literature.
As noted earlier, the data for TR3, the accelerometer that is placed on the side of the housing, has an unusually high standard deviation relative to the other transducers. It is felt that this transducer was most susceptible to the assembly and disassembly of the gearbox when changing out gears, and because of this greater variability, it was decided to not include its data in the rest of the analyses.
Interesting Observations of the Difference Tests
- Aside from transducer 3, the standard deviations are typically from 0.4 to 0.8 dB.
- Taking a typical mean difference of -1 dB and a standard deviation of 0.6, one gets the 90 percent confidence interval of the mean to be between 0.0 and -2.0, a width of 2 dB that is not far off from the range of 3 dB measured by Drago, et al. [28, 29].
- The average mean difference is about -2 dB for the lightest load and -1dB for the three higher loads.
- It is interesting that at the lightest load, the first harmonic levels are consistently much less than the second harmonic differences. This trend is consistent with the LDP prediction where ADI gears are predicted to be quieter than the steel gears.
- At higher torques at mesh frequency, however, the steel gears are predicted to be quieter than the ADI gears, and this does not occur in the experiment, even though the noise difference is less than for the lighter loads.
Major Results and Comments
- There is virtually no difference between the microgeometries of the gears of the two tested materials. As such, the only difference in the results should be due to the modulus differences and possibly damping between the gears.
- LDP predicted sum of forces [2], the most all-encompassing gear whine mesh excitation metric, indicate that in the low torque range, the noise of the ADI gears should be 2 to 3 dB quieter than the steel gears, and at the higher torques should be 1 to 2 dB louder than the steel gears. This is mainly due to the different moduli of the two materials.
- From measured data, the ADI gears are consistently from 1 to 2 dB quieter than the steel gears, a value that is considered to be undetectable by the human ear and within the limits of noise level measurement accuracy.
- Qualitatively, when observing matched order traces of ADI and steel, the plots have extremely similar traces, with most regions having the ADI to be slightly quieter but a few other frequency ranges having the steel to be quieter. Overall, however, there is a slight leaning towards ADI being slightly quieter than steel.
- At twice mesh frequency, excitations are predicted to be virtually identical for the two materials across the entire load range. The experimental data showed this to be reasonably true.
- The side plate bearing accelerometer seems to have much more variation than do the other transducers, probably due to the plate being remounted with each assembly of the gears. It was therefore not used in some of the analyses.
- The number two microphone (farthest from the gearbox) shows much more variation in signal with torque than do any of the other sensors.
- All resonances seem to have nearly the same damping for each material, thus indicating that the modes included in this analysis were not affected by the higher material damping of the ADI material.
- Repeatability was discovered to be a serious problem, particularly when looking at an arbitrary running speed. When speed sweeps were performed, at any one speed, there could be differences as high as 8 dB between the two materials, but in general, the repeatability differences averaged out to 1 to 2 dB when observing the entire frequency range of the data.
Conclusion
Based on the results of both the modeling and testing, one could comfortably say that for gear whine, the ADI gears are slightly quieter than equivalent steel gears. However, since the difference in noise generated is quite small (1 to 4 dB), there are instances when the steel gears are quieter than the ADI gears. The literature has mentioned a couple of cases where there were significantly larger reductions of noise using ADI gears, and those numbers were not obtained with either this testing or the noise excitation prediction models. Although no experiments were run on the gear rattle phenomenon, engineering logic would lead one to believe that, due to the increased damping, it is quite likely that ADI gears will have a quieter rattle signature than do steel gears.
References
- Brandenberg, K., Hayrynen, K.L., Keough, J.R. “Austempered Gears and Shafts: Tough Solutions.”
- Keough, J.R., Laird, Jr., W.J., Godding, A.D., eds. “Austempering of Steel,” Heat Treating. ASM Handbook, Vol. 4, revised 1995.
- Kovacs, V., and Keough, J.R., “Physical Properties and Applications of Austempered Gray Iron,” American Foundrymen’s Society (AFS) Transactions, 1993.
- Keough, J.R. “Austempered Materials and their Applications to Drive Line and Suspension Components,” SAE Paper 2000-01-2563, International Offline Highway and Powerplant Congress and Exposition, Milwaukee, Sept. 2000.
- Graham, P. Ductile Iron as a Gear Material AGMA Fall Technical Meeting Paper 99FTM7, 1999.
- Breen, D., Doane, D.V., “Austempered Ductile Iron Database,” ASME Gear Research Institute, final Report, Project A4001, U.S. Department of Commerce, June 1989.
- Vold, H. and Deel, J. “Vold-Kalman Order Tracking: New Methods for Vehicle Sound Quality and Drive-Train NVH Applications.” SAE Paper 972033, Proc., SAE Automotive NVH Conf.; Traverse City. 1997: 1275-1281.
- Houser, D.R., Singh, R., Gear Noise Short Course Notes, published by NVH and Gear Education, NVHgear.org, 2015.
- Houser, D.R., “Gear Noise,” Chapter in Dudley’s Gear Handbook, D. Townsend, Ed., McGraw Hill, New York, 1991.
- Houser, D.R., “Gear Noise Prediction and Control Methods,” Chapter in Handbook of Noise and Vibration Control, M.J. Crocker, Ed. J Wiley and Sons, 2007, pp. 847-856.
- Munro, R.G.: “A review of the theory and measurement of gear transmission error”, Proc. First IMechE International Gear Conference, Cambridge, UK, April, 1990
- Borner, J. and Houser, D., “Friction and Bending Moments as Gear Noise Excitations,” SAE Technical Paper 961816, 1996, Also, in SAE 1996 Trans. – Journal of Passenger Cars – V105-6.
- Padmanabhan, M., Barlow, R. C., Rook, T.E., Singh, R., “Computational Issues Associated with Gear Rattle Analysis,” ASME Journal of Mechanical Design, Vol. 117, 1995, pp. 185-192.
- O’Rourke, R., Grander, M., “Cast Iron: A Solid Choice for Reducing Gear Noise,” Gear Technology, September/October 1999, pp. 46–49.
- Pokorovskii, A.I., Chaus, A.S., Kunovskii, E.B. “Effect of the shape of graphite inclusions on acoustic characteristics of articles from cast and deformed iron,” Metal Science and Heat Treatment, Vol. 53, Nos. 7-8, November 2011, pp. 311–317.
- Harding, R.A. “The use of austempered ductile irons for gears,” Proceedings, 1986 Paris Gearing Conference, pp. 349–363,1986.
- Lottridge, N.M. and Grindahl, R. B. “Nodular iron hypoid gears,” Proc. SAE Conf. on Fatigue (P109) Dearborn, 1982, pp. 213-218.
- Hornung, K., “Gears from bainitic nodular cast iron,” Ph.D. dissertation, Technical University of Munich, 1983.
- Johansson, M., Vesanen, A., Rettig, H. “Austenitic-bainitic cast iron with spheroidal graphite as construction material for gears,” Antriebestechnik, bol. 15, No. 11, 1976, pp. 593-600.
- Brandenburg, K.R., Hayrynen, K.L., “Agricultural Applications of Austempered Ductile Iron,” Applied Process white paper, Sept. 25, 2002.
- Hornung, K., Hauke, W., “Austempered Ductile Iron – A Material for Gears,” Proc., First International conf. on austempered Ductile Iron, ASM, April 1984, page 185.
- Bradley, W. “AGMA gear tribology test report,” AGMA Rating Committee and AGMA Foundation, 2007.
- Houser, Donald R., User’s guide to LDP, The Ohio State University GearLab, 2011
- Conry, T. F., Seireg, A., “A Mathematical Programming Technique for the Evaluation of Load Distribution and Optimal Modifications for Gear Systems,” Journal of Engr. For Industry, Trans. ASME, Vol. 95, No. 4, Nov. 1973, pp. 1,115-1,123.
- Harianto, J., Houser, D.R., “Design robustness and its effect on transmission error and other design parameters,” Proceedings of the International Conference on Mechanical Transmissions, Chongqing, China, 2001, pp. 17-24.
- Vold, H., Leuridan, J., “High Resolution Order Tracking at Extreme Slew Rates, using Kalman Tracking Filters,” SAE Technical Paper No. 931288, Noise & Vibration Conference & Exposition, Traverse City, Michigan, May 1993.
- Drago, R.; Lenski, J.; Spencer, R.; Valco, M., and Oswald, F. B. The Relative Noise Levels of Parallel Axis Gear Sets with Various Contact Ratios and Gear Tooth Forms. Proc., AGMA Technical Conference Paper 93FTM11; Detroit. 1993 Also, ARL-TR-318; NAS3-25421. 1993.
- Houser, D. R.; Oswald, F. B.; Valco, M. J.; Drago, R. J., and Lenski, J. W. “Comparison of Transmission Error Predictions with Noise Measurements for Several Spur and Helical Gears.” Proc., 30th AIAA/ASME/SAE/ASEE Joint Propulsion Conference; Indianapolis, IN. 1994.


