


Hard turning and grinding are competing finishing processes for the manufacture of precision mechanical components such as bearings, gears, cams, etc. Surface hardening at gentle machining conditions has often been reported and is attributed to strain/strain rate hardening and size effect. However, some studies have reported surface softening in the near surface of components by hard turning with a sharp cutting tool. The apparent softening was attributed to thermal effects by high cutting temperatures. The process induced surface integrity is of great importance for component performance in service. Since the reported surface property is inconsistent for hard turning with a fresh cutting tool, it is imperative to clarify surface hardening mechanisms in hard turning. The purpose of this paper is to investigate surface hardening and the interpretation of the reported thermal softening. Hard turning and grinding of AISI 52100 steel was conducted using gentle machining conditions. Surface integrity was then analyzed in terms of surface finish, microstructure, and surface and subsurface micro and nanohardness. Hard turning may produce equivalent or better surface finishing compared with grinding. The research findings showed that the apparent softening measured using microindentation in near surface is not due to thermal effects, but rather a misinterpretation of hardness values due to improper testing technique. Hard turning induces a thicker plastically deformed zone than grinding, while grinding temperatures penetrate deeper into the subsurface. However, size effect is more prominent in grinding than turning, which produces higher hardness on the ground surface and in the subsurface.
Introduction
Hard turning and grinding have emerged as competing processes in the manufacture of precision components such as bearings, cams, and shafts. Although grinding has traditionally been the dominant method for producing such parts on a large scale, the need for more environmentally friendly machining processes has led to increased interest in hard turning [Herzog, 1982; Shiplet, 1982; Konig, et al., 1984]. During hard machining of steels, the surface material experiences severe strains and strain rates which cause the crystal lattice in the machined layer to severely distort. The severe materials deformation and friction between the tool and workpiece may generate high temperatures. The combined effect of severe deformation, high local temperatures, and rapid quenching rates causes the machined surface to undergo both physical and metallurgical changes [Field and Khales, 1964; Griffiths, 1985; Matsumoto, et al., 1986; Töenshoff, et al., 1995; Naik, et al., 1997; Ackan, et al., 1999; Thiele and Melkote, 1999; Guo and Janowski, 2004; Guo and Sahni, 2004]. An increase in strength and hardness can be achieved at the surface due to a reduction in grain size and dislocation entanglement caused by the lattice distortion. By selecting proper machining parameters, both grinding and hard turning are capable of producing very good surface finish.
However, other surface integrity characteristics such as hardness, microstructure, residual stress, can be significantly different between the two machining methods [Guo and Janowski, 2004; Guo and Sahni, 2004]. Component performance such as friction [Singh, et al., 2005], wear [Jhahanmir and Suh, 1997; Bartha, et al., 2005], and rolling contact fatigue [Matsumoto, et al., 1999; Guo and Schwach, 2005; Schwach and Guo, 2005] can be greatly affected by the combined effect of all surface integrity characteristics.
Increased surface hardness has often been reported [Guo and Warren, 2004; Sasahara, 2005] at gentle machining conditions and shown to improve wear resistance in parts subjected to sliding contact [Viáfara, et al., 2005]. In the absence of phase transformed regions such as the “white layer” formed during abusive machining of steels, the increased surface hardness aids in increasing the fatigue life of components [Schwach and Guo, 2005]. A recent study [Shi and Liu, 2005] has shown a decrease in hardness at the machined surface by hard turning with fresh cutting tools. This finding was attributed to thermal softening at the machined surface due high temperatures generated by tool flank wear.
Since the process induced surface integrity is of great importance for component performance in service, it is imperative to clarify surface hardening mechanisms in hard turning. The focus of this study is two–fold: (1) to understand surface structure and properties of machined components; and (2) clarify potentially misleading interpretations of hardness measurement due to improper experimental methods. A hypothesis is proposed and evaluated that the reported decrease in hardness at the surface produced by fresh cutting tools is not due to thermal softening, but rather a result of “edge effect” caused by the lack of material between the indenter and top surface during hardness measurement on cross–section subsurface of test specimens. “Edge effect,” as termed in this paper, is simply a decrease in resistance to deformation by the indenter near the edge of the test specimen due to a lack of constraint at the free surface.
To substantiate this hypothesis, test specimens of AISI 52100 steel were machined according to good practice by hard turning and grinding using gentle machining conditions. Surface finish was characterized by both optical microscope and stylus. Micro and nanohardness measurements were then taken on the very top machined surface and as a function of depth in the subsurface. Subsurface microstructure was observed by both optical and scanning electron microscopy.
Machining Tests
Work samples of AISI 52100 steel were cut from a 76.2 mm diameter solid bar at 19.05 mm thickness. The test specimens were then machined to ensure parallelism and perpendicularity before heat treatment. Heat treatment consisted of austenizing at a temperature of 815°C for two hours, followed by quenching in an oil bath at 65°C for 15 minutes. Finally, tempering was conducted at 176°C for two hours, which produced a final hardness of 61–62 HRC.


It is extremely difficult, if not impossible, to turn or grind a surface using the best machining conditions. A practical approach to compare surface finish between the turned and ground surfaces is to use the “best achievable” machining conditions. The test specimens were machined by both turning and grinding as shown in Table 1 and Table 2. The machining parameters were selected which fall within the gentle machining range so as to ensure that there would be no phase transformations on the machined surface. The face turning operation was conducted using a CNC Bridgeport lathe which is able to maintain a constant cutting velocity as the cutting tool moved from the outer edge to the center of the workpiece. A fresh round CBN cutting tool insert was used for the facing operation and was rotated several degrees after each sample was completed in order to use a fresh cutting edge in each cutting test. Grinding was performed using an Al2O3 wheel which was dressed prior to machining and ample coolant was used to prevent excessive heat at the machined surface. After machining, test samples were cross–sectioned with an abrasive cutter, mounted in epoxy, and polished with alumina polishing compound until a mirror finish was obtained. A tapered section was not used because it does not allow material properties to be accurately correlated with subsurface depth. Surface integrity of the machined specimens was then characterized by surface finish, microstructure, and micro/nanohardness.
Experimental Procedure and Results
Surface Finish Characterization
Surface finish was characterized by both an optical microscope and by stylus measurement. Optical images of the as turned and as ground surfaces as well as the subsequently polished surfaces are shown in Figure 1 (a–d). The ground and feed marks are clearly seen on both surfaces, and each is characterized by the corresponding machining method. The grinding wheel is composed of many random irregular bonded abrasives, and therefore the machined surface has a random distribution of grinding marks. In contrast, hard turning is performed by a geometrically defined cutting edge, and therefore the feed marks have a uniform spacing determined by the prescribed feed rate. Surface profile measurement was carried out using a stylus profilometer. The average surface roughness, Ra, is calculated for all cases and is summarized in Table 3.


As a result of the shallow depth of cut and small feed rates used in the turning process, the as–turned surface roughness is better (≈30 percent) than that of the as–ground surface. The surface roughness of the samples after polishing is within ±15 percent of each other. The roughness Ra between 0.06 μm ~ 0.07 μm of the polished surfaces is smooth enough to eliminate or at least minimize the roughness effects on micro/nanoindentation.
Subsurface Microstructure
In order to view subsurface microstructure of the specimens after machining, the samples were polished to an acceptable mirror finish and then etched with a 2 percent nital solution. Optical microscope images of the cross–sections of the test specimen are shown in Figure 2 (a–b). Both turned and ground surfaces are free of thermal damage. It is interesting to note that a thermal damage free surface has two clearly visible zones characterized by: the strain hardened zone in near surface and the thermal affected zone in subsurface (not softened compared with bulk hardness as seen in the following section). It should be pointed out the strain hardened zone is not a white layer despite its appearance similar to the bulk material, and the thermal affected zone is not a dark layer encountered in hard turning using a worn cutting tool. The different appearance of the two zones is just due to their different resistance to etching as a result of different grain deformation and size. For comparison purpose, white and dark layers produced by hard turning with a worn tool are shown in Figure 3.


The ground specimen reveals a strain hardened zone approximately 4 μm thick and the thermal affected zone 14 μm. The turned specimen had a strain hardened zone 6 μm thick and the thermal affected zone 8 μm. The ratio of the strain hardened layer to the thermal affected layer is about 1/3 for the ground subsurface, which is much smaller than the ratio of 3/4 for the turned surface. These results indicate that hard turning induces a thicker plastically deformed zone than grinding, while grinding may generate higher surface temperatures which penetrate deeper into the subsurface. It also implies that mechanical deformation plays a larger role during turning, whereas thermal effect is more dominant during grinding even at gentle machining conditions.
Scanning electron microscopy was also used to observe the subsurface microstructure with increased magnification as shown in Figure 4 (a–b). Bulk AISI 52100 steel is composed of a low tempered martensite with mostly spherical carbide particle ranging in size from 0.2 to 1.2 μm. At the near surface, the second phase particles size becomes slightly smaller for both turning and grinding. The second phase particle size is smaller for the ground subsurface than the turned subsurface. This may be attributed to the deeper thermal penetration during grinding.

Surface and Subsurface Microhardness
Surface Microhardness. Microhardness was measured with a Knoop indenter at a load of 25 gf. The first measurements were made directly on the very top surface to determine if thermal softening had occurred. The microhardness of the top surface was measured as machined and as polished for comparative purposes. Microhardness is determined by Eq. as
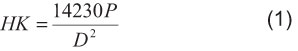
where P (gf) is the applied load and D (μm) is the length of the long diagonal made by the indenter.
The results are summarized in Table 4. Before polishing, the surface microhardness was measured as 1182.9 and 928.7 HK for the as ground and as turned samples, respectively. The samples were then polished to an average surface roughness of 0.07 μm which revealed hardness values of 1148.2 and 1046.1 HK for the polished ground and turned specimens, respectively. The microhardness of the ground surface is therefore about 27 percent, and 10 percent higher than those of the as–turned and as–polished surfaces.

Subsurface Microhardness
Subsurface measurements were performed as a 10 × 3 matrix with row and column spacings of 7 μm and 20 μm, respectively, as shown in Figure 5. The microhardness is shown in Figure 6 as a function of depth below the surface for both machined specimens. The ground specimens had a higher hardness not only on the top surface but also throughout a depth of 100 μm when compared to the turned ones. At depths greater than 100 μm the hardness of both specimens become uniform. While measuring microhardness as a function of depth on the specimen cross sections it was observed that the hardness was lowest at the positions nearest to the machined surface. A previous study [Shi and Liu, 2005] has also observed this trend and attributed the measured low hardness data to thermal softening in the near surface region resulting from the machining process with a fresh cutting tool. The measured low microhardness value in subsurface may easily lead to a misunderstanding of surface material properties. This study shows that the apparent softening is not due to thermal effects, but rather is caused by the lack of material between the indented area and top surface, which results in less resistance to deformation by a microindenter. In other words, the indent size made by a microhardness test is too large for the interested near surface layer. However, microhardness test is still feasible as long as the measured area is sufficiently larger than the microindent size. This finding is clearly confirmed by the measured hardness on the machined surface, which is higher than that of the subsurface and bulk material. In addition, the measured low microhardness also occurs for white layer on a tapered cross section [Guo and Sahni, 2004], which is unanimously agreed not to be a thermal softened layer. This study suggests that whether a surface is hardened or softened depends on surface hardness on the very top surface, which must be measured to avoid the potential misleading understanding of surface properties.


Surface and Subsurface Nanohardness
As explained in the previous section, indent size in a hardness test is critical to evaluate material property in a small area. Since the machined surface is hardened by hard turning and grinding at gentle machining conditions, it is a natural question to ask if the increased hardness can be directly measured in subsurface. Nanoindentation provides a feasible approach for precision machined surface [Guo and Warren, 2004] to avoid the potential “edge effect” since the nanoindent size is substantially smaller than that of a microindent. The edge effect can be eliminated or minimized if a nanoindent is a certain distance (~1 μm) below the machined surface. Nanohardness was measured using a Hysitron Triboindenter nanohardness tester. The measurements were made with a diamond Berkovich indenter and performed as open loop with a maximum load of 8 mN.
Before calibrating the indenter, a machine compliance correction was made following the established standard procedure [Guo and Warren, 2004]. The indentations then followed an automated process until all indentations had been performed. The standard procedure for nanoindentation analysis is to use the unloading data for analysis. This has been proven to be a reliable and accurate method for determining contact hardness and the initial unloading contact stiffness. The hardness values for each indentation were determined from the recorded load vs. depth curves. Nanohardness can be calculated as
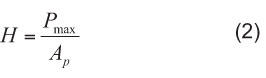
where Pmax is the maximum applied load and p A is the projected area of contact of the indenter at the maximum load. Ap is a function of indentation depth and geometry of the indenter and is determined by calibration indents into a specimen of fused quartz for which the hardness and modulus are known. The average value and variation of hardness for each row of indentations were then calculated following the established approach [Guo and Warren, 2004].
Surface Nanohardness. Nanohardness of the machined surface was determined using a 3 × 3 matrix of indentations directly on the top surface. Due to the small size of the indents made by nanoindentation, the surface of test specimens were polished to a mirror finish to minimize error associated with indenting scratch marks and voids on the surface. The average nanohardness was determined for both the as polished ground and turned surfaces as 8.80 GPa and 6.99 GPa, respectively. This trend agrees in nature with the measured microhardness data in Table 4.
Subsurface Nanohardness. For reliable measurement, subsurface nanohardness was determined using a 3 × 8 matrix of indentations as shown in Figure 7, with row and column spacing of 5 μm and 7 μm, respectively. The top rows of indentations were located approximately 1.5 μm from the machined surfaces. Figure 8 shows the nanohardness variation for both the ground and turned samples as function of depth below the surface. The surface nanohardness for the ground specimen is about 25 percent higher than that of the turned specimen. It is clear to see that the nanohardness of the first point in subsurface does not show dramatic decrease when compared with those by microhardness test in Figure 6. Therefore, it is important to note that the so called “softening effect” in the near surface that was observed in the microhardness tests was not seen using the nanoindentation technique. This is most likely due to the comparatively small loads and indent size used in nanoindentation as opposed to microindentation. Because of the small load (8 mN) and the shallow depth of penetration (≈ 200 nm) used in nanoindentation, the edge effect observed in microindentation is not present.


The nanohardness for the as–ground specimen remains slightly higher than that of the as–turned sample to a depth of approximately 30 μm, at which point the hardness values converge. The turned sample showed a slightly increased hardness in the near surface and a fairly constant hardness throughout the measured depth range. The nanohardness agrees in trend with the measured microhardness data in Figure 6.
The basic mechanism for the more hardened ground surface/subsurface is most likely due to the size effect induced by severe strain gradient in grinding. The smaller down feed in grinding induces a severe strain gradient in near surface, while the relatively larger depth of cut in turning may substantially reduce the size effect.
Conclusions
AISI 52100 steel specimens were prepared by hard turning and grinding using gentle machining conditions. Surface integrity was characterized by surface finish, microstructure, and micro/nanohardness. The major findings can be summarized as follows:
• Hard turning can achieve very smooth surfaces being equivalent to grinding. The turned surfaces have much wider and more regular feed marks than those of the ground ones.
• The as–turned surface shows a uniform feed mark pattern, while the as–ground surface has a more random pattern of grinding marks aligned in the cutting direction.
• Hard turning induces a thicker plastically deformed zone than grinding, while grinding may generate higher surface temperatures which penetrate deeper into the subsurface.
• The measured low microhardness value or apparent softening in subsurface is not due to thermal effects, but rather is caused by the “edge effect,” which can be confirmed by both microhardess and nanohardness measurement on the very top surface and in subsurface.
• The ground surface had a size effect induced higher hardness not only on the top surface, but also throughout a certain depth in subsurface when compared to the turned one. The measured nanohardness agrees in trend with the measured microhardness data.
Acknowledgments
This research is based upon work supported by the National Science Foundation under Grant No. DMI–0447452. The authors would like to thank Dr. M.E. Barkey of Dept. of Aerospace Engineering and Mechanics and Dr. M.L. Weaver of Metallurgical and Materials Engineering at the University of Alabama for providing partial facilities to conduct the experiments.
References
• Akcan, S., S. Shah, S.P. Moylan, P.N. Chhabra, S. Chandrasekar, and T.N. Farris, (1999), “Characteristics of White Layers Formed in Steel by Machining,” ASME MED, 10, pp. 789–795.
• Bartha, B.B., J. Zawadzki, S. Chandrasekar, and T.N. Farris, (2005) “Wear of Hard Turned AISI 52100 Steel,” Metallurgical and Materials Tran., 36A, pp. 1417–1425.
• Field, M., and J.F Khales, (1964), “The Surface Integrity of Machined and Ground High Strength Steels,” Defense Metals Information Center Report, Columbus, Ohio, pp. 54–77.
• Griffiths, B.J., (1985), “White Layer Formations at Machined Surfaces and Their Relationship to White Layer Formations at Worn Surfaces,” ASME J. Tribology, 107, pp. 165–171.
• Guo, Y.B. and A.W. Warren, (2004), “Microscale Mechanical Behavior of the Subsurface by Finishing Processes,” ASME J. Manuf. Sci. Eng., 127, pp. 333–338.
• Guo, Y.B. and D.W. Schwach, (2005), “An Experimental Investigation of White Layer on Rolling Contact Fatigue Using Acoustic Emission Technique” Int. J. Fatigue, 27, pp. 1051–1061.
• Guo, Y.B. and G.M. Janowski, (2004), “Microstructural Characterization of White Layers by Hard Turning and Grinding,” Trans. NAMRI/SME, XXXII, pp. 367–374.
• Guo, Y.B. and J. Sahni, (2004), “A Comparative Study of the White Layer by Hard Turning versus Grinding,” Int. J. Machine Tools and Manufacture, 44, pp. 135–145.
• Herzog, D.E., (1982), “Now: Turn Hardened Steels and Tough Superalloys as Easily as Mild Steels,” Machining Hard Materials, Williams, R., ed., SME, Dearborn, MI.
• Jhahanmir, S. and N.P. Suh, (1977), “Surface Topography and Integrity Effects on Sliding Wear,” Wear, 44, pp. 87–99.
• Konig, W., R. Komanduri, H,K. Toenshoff, and Ackerschott, (1984), “Machining of Hard Materials,” Ann. CIRP, 33, pp. 417–427.
• Matsumoto, Y., F. Hashimoto, and G. Lahoti, (1999), “Surface Integrity Generated by Precision Hard Turning,” Ann. CIRP, 48, pp. 59–62.
• Matsumoto, Y., M.M. Barash, and C.R. Liu, (1986), “Effect of Hardness on the Surface Integrity of AISI 4340 Steel,” J. Eng. Ind., 108, pp. 169–175.
• Naik, S., C. Guo, S. Malkin, D.V. Viens, C.M. Pater, and S.G. Reder, (1997), “Experimental Investigation of Hard Turning,” 2nd Int. Mach. & Grinding Conf., Dearborn, MI, pp. 224–308.
• Sasahara, H, (2005), “The effect on fatigue life of residual stress and surface hardness resulting from different cutting conditions of 0.45% C steel,” Int. J. Machine Tools and Manufacture, 45, pp. 131–136.
• Schwach, D.W and Y.B. Guo, (2005), “A Fundamental Study on the Impact of Surface Integrity by Hard Turning on Rolling Contact Fatigue,” Trans. NAMRI/SME, XXXIII, pp. 541–548.
• Shi, J., and C.R. Liu, (2005), “On Predicting Softening Effects in Hard Turned Surfaces—Part II: Finite Element Modeling and Verification,” ASME J. Manuf. Sci. Eng., 127, pp. 484–491.
• Shiplet, T., (1982), “Hard Turning–A New Alternative to Grinding,” The Carbide and Tool Journal, Jan.–Feb.
• Singh, R., S.N. Melkote, F. Hashimoto, (2005), “Frictional Response of Precision Finished Surfaces in Pure Sliding,” Wear, 258, pp. 1500–1509.
• Thiele, J.D. and S.N. Melkote, (1999), “The Effect of Tool Edge Geometry on Workpiece Sub–Surface Deformation and Through–Thickness Residual Stresses for Hard–Turning of AISI 52100 Steel,” Trans. NAMRI/SME, XXVII, pp. 167–173.
• Töenshoff, H.K., H.G. Wobker, and D. Brandt, (1995), “Hard Turning–Influences on the Workpiece Properties,” NAMRI/SME, XXIII, pp. 215–220.
• Viáfara, C.C, M.I. Castro, J.M. Vélez, and A. Toro, (2005) “Unlubricated Sliding Wear of Pearlitic and Bainitic Steels”, Wear, 259, pp. 405–411.


